The EVRYTHNG Dashboard
The EVRYTHNG Dashboard is a GUI web application for managing resources in your account and testing application functionality. The Dashboard provides an alternative to using the REST API. Besides managing Platform resources, you can use dashboard views to gain insight into overall trends.

Getting Started
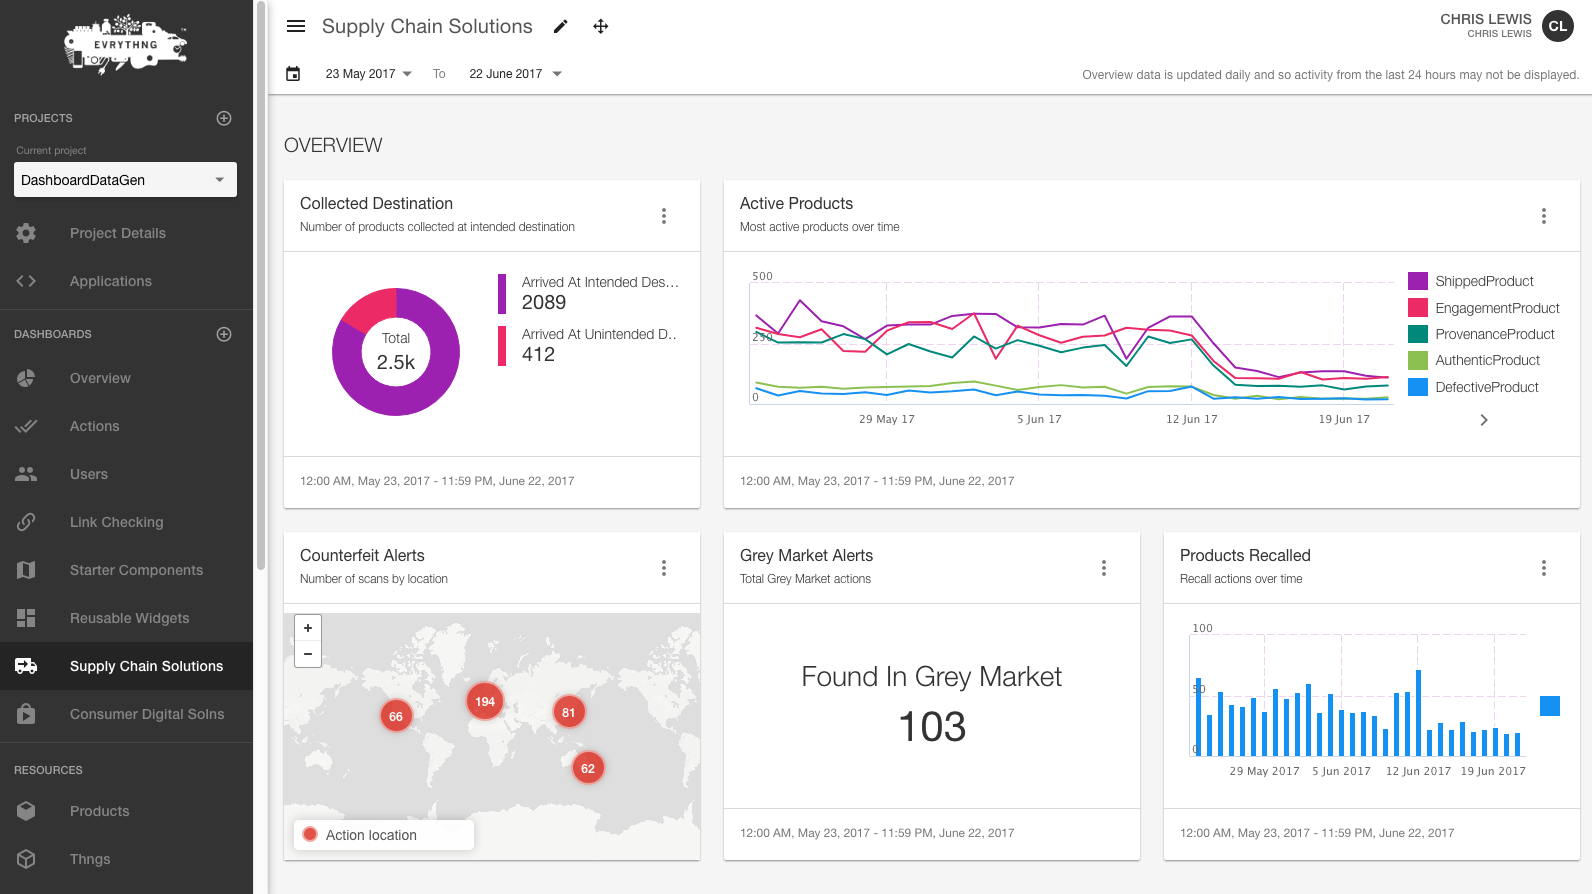
After you've signed up for an account, go to dashboard.evrythng.com and sign in. You're greeted with an overview of your account. You see a list of all projects and some built-in widgets, giving insight into recent account activity, user counts, and summaries of the most active resources in the past month. The time filter can be adjusted with the controls at the top of the page.
Navigation
The different sections of the left navigation pane show the available dashboard views. You see summaries of various resource types including users, products, Thngs, action types, and so on. The items that you can view change, depending on the current project scope.
To change the project scope, use the Current project selector at the top of the navigation pane.
The pane itself can be collapsed and expanded by using the menu icon. The navigation pane is automatically collapsed on smaller devices to maximize the available screen space for viewing data. Near the bottom of the navigation pane are links for Testing capabilities and a Docs link to this documentation.
In the top-right area of the screen are the user settings, account information, and logout options. If you have access to multiple accounts, you can switch between them here.
Built-in Dashboard Views
The default dashboard views give overviews of common data sets and trends. They include the following three pages:
Overview
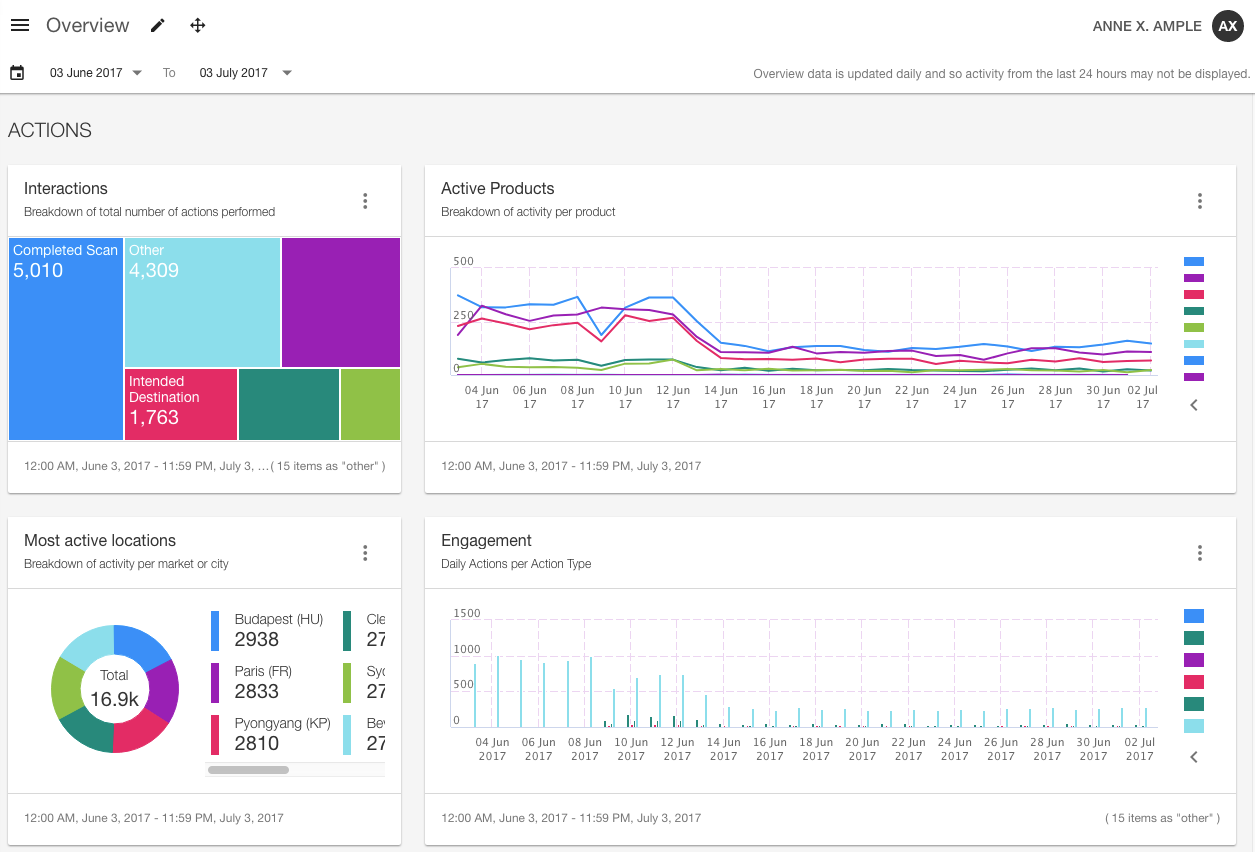
Overview is the default view, shown upon logging in. It gives insight into the most active resources and overall resource counts for all available projects. You can select each project for a further summary of its contained applications for the same metrics. This view can also be customized to your requirements. An example layout is shown below.

You can customize and configure the default widgets that appear on the Overview page. Read Widgets to learn how.
Actions
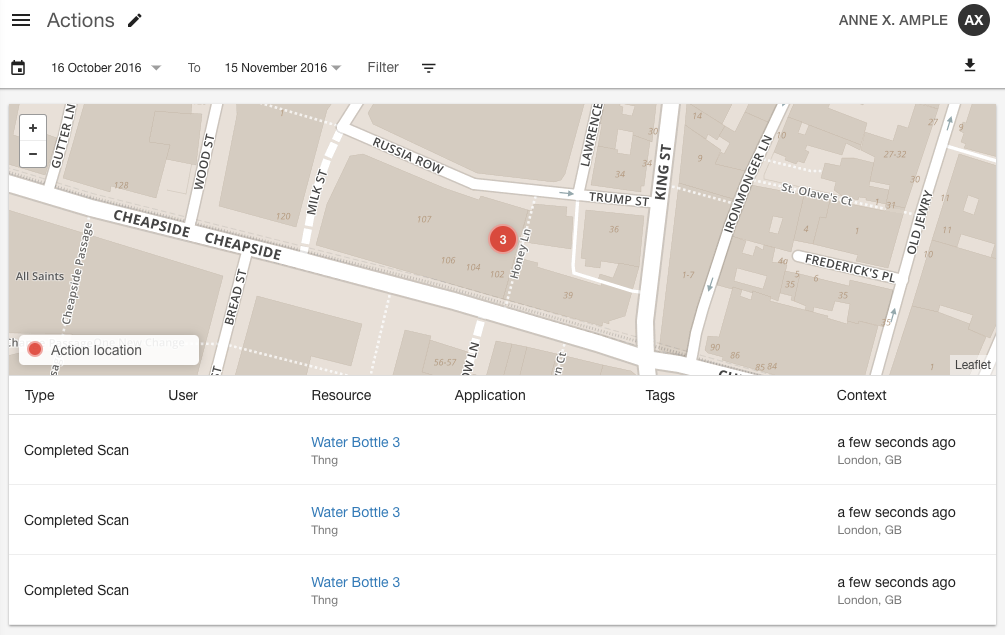
Actions provide a view of the most recent actions that occurred in the context of the current project. Each action is listed in a table under an interactive map that shows a summary of the locations where the actions occurred. Each entry gives the location, time, and resource that was involved.

Click Download in the top right corner of the view to get a table of actions.
Users
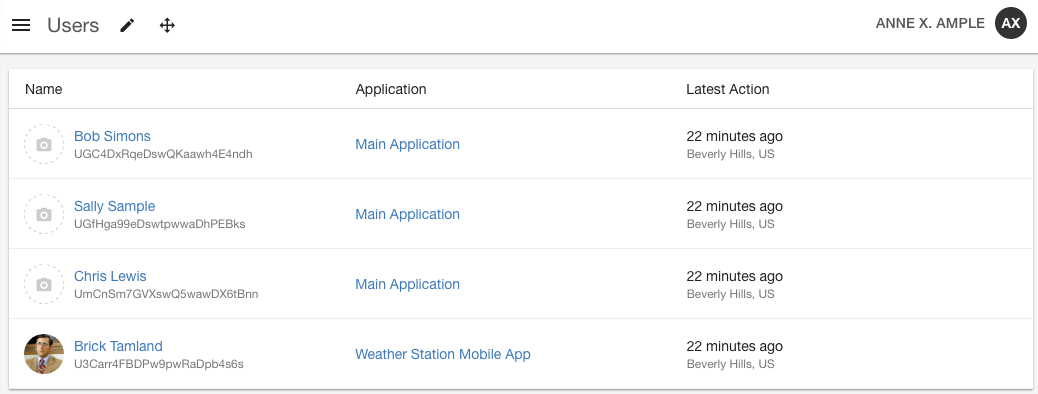
Users offers a view of all the users in the currently selected project, showing their photos, first and last names, the application they belong to, and the last time they were active. Clicking a user shows more detail about them, including their ID, recent timestamps (created at, updated at, and so on), and any additional fields or metadata on record.

Custom Dashboards
Besides the built-in dashboard views shown above, developers can create their own dashboard with custom widgets and layouts. Read Customization for more information about creating dashboards and widgets.
To learn how to customize and reuse the existing widgets in a new dashboard section, see Widgets.
Updated 11 months ago
