Using the Data
After the consumer engagement scanning campaign has been operating for a while, the Platform account will have accumulated some useful data about which products have been interacted with, by users in which locations, and how often. Developers can consume this data directly through the API or visualize it through the reusable widgets available in the EVRYTHNG Dashboard.
Creating a New Dashboard
After some actions for product engagement events have been created, the EVRYTHNG Dashboard can be configured to display insights in the form of customizable widgets. For example, to show the location and action frequency of the different types of actions, or which type of event is the most common in each location. Start by opening the Dashboard.
Import the example dashboardInstead of adding the widgets described below manually, use the 'Import Dashboard' button in the 'Add dashboard' dialog to import the example dashboard.
To start implementing this, create a new Dashboard section using the plus icon next to ‘Dashboards’ in the left hand pane. Give the section a name (such as ‘Consumer Engagement’), and optionally choose an icon (such as Qrcode scan), then click ‘Add Dashboard’. Once the new section has been created, click the pencil icon at the top of the page to begin adding widgets.
Adding New Widgets
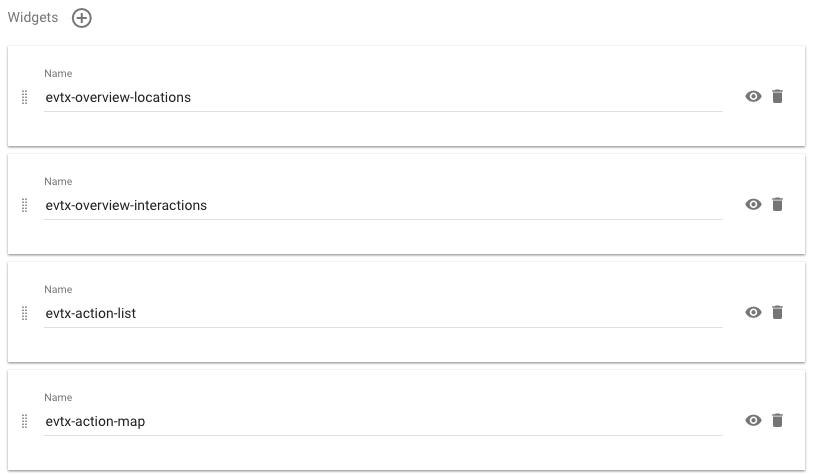
Create the first section using the left hand side of the modal section editing dialog, then add the following widgets one by one using the names provided:
evtx-action-map- A map of all actions in the world.evtx-action-list- A list of all actions, including the most recent.evtx-overview-interactions- Most active actions by type.evtx-overview-locations- Active locations where actions were created.
At the end, you should have a dashboard section configuration as follows:

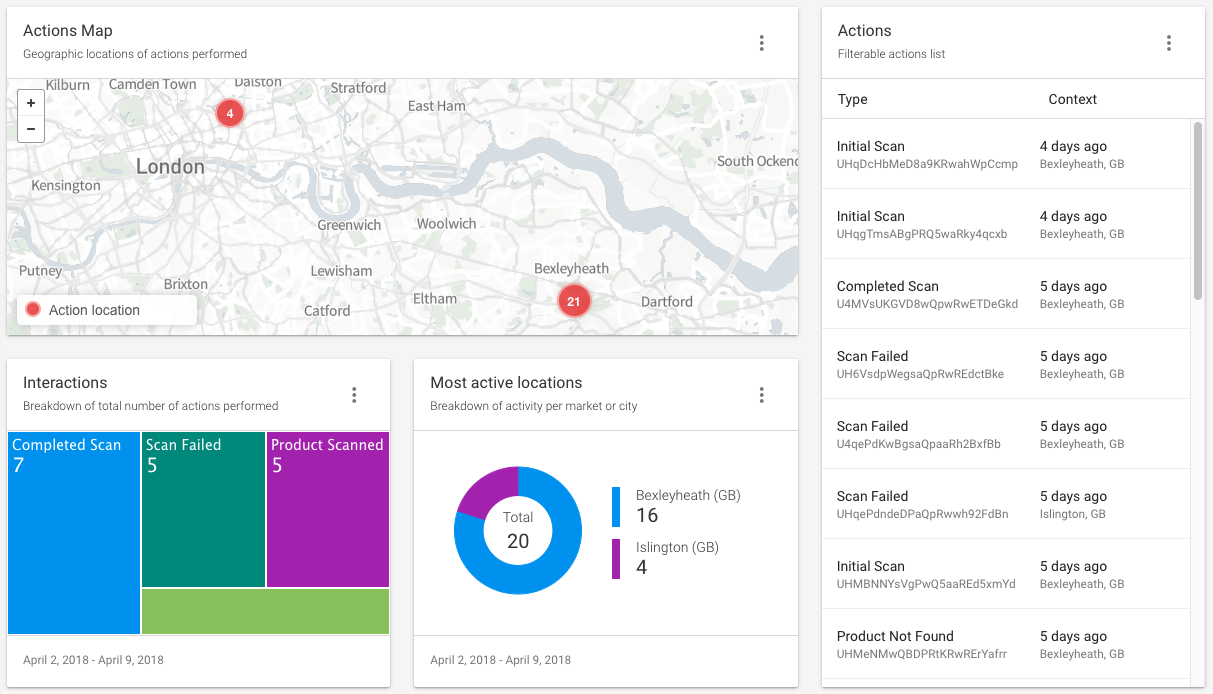
Click ‘Update’ and confirm to save the new widget configuration. After the page has reloaded, use the 'Move and resize widgets' button in the toolbar at the top to rearrange the widgets to suit. Also consider adding action filters to the widgets that allow filtering, and customizing the titles and descriptions to more accurately reflect the insights the action types and widgets chosen actually represent. The image below contains a suggested configuration and layout that would make sense for the consumer engagement scanning experience use-case.
Once a few days of data has been accumulated (for the purposes of this walkthrough either manually created, or automatically generated with a Reactor schedule) the above widget configuration should look similar to the image below, and begin to give insights into the location and frequency of different action types as a result of user interaction.

Adding a GS1 Digital Link
While providing a QR code containing a short URL is a great step towards a serialised consumer engagement experience, by replacing the short URL code with one containing a GS1 Digital Link (readable by a consumer's phone as well as existing PoS and inventory systems), the bond between consumer and brand can be even more valuable to both sides. Read the next section to learn how to add this to your own products.
Updated 9 months ago
