Using the Data
Once the weather stations have observed the local weather for a while, they will have accumulated some useful data about weather trends. Developers can utilise this data directly via the API or visualise it through the reusable widgets available in the EVRYTHNG Dashboard. We will also consider how to limit access to data through the Roles and Permissions APIs.
Limit Visibility with Roles
In a nutshell, the Roles and Permissions APIs allow account operators to limit visibility of other operators and Application Users to only certain projects that they are concerned with. For example, if the weather station account contained sensitive location data associated with users in a separate project, the Operator role can be adjusted to limit access to only that project. Similarly, users of the mobile app can have their access restricted to only specific products or Thngs with Application User roles, such as only the weather station Thng or products that they are permitted to manage.
The implementation of this part of the API will not be directly explored here due to its level of detail, so be sure to read the Roles and Permissions page for all the relevant information.
Display Data with Widgets
Once a number of actions for weather events have been created, the EVRYTHNG Dashboard can be configured to display insights in the form of customisable widgets. For example, to show the locations of the weather events, or which type of event is the most common in each location. Begin by opening the Dashboard.
Import the example dashboardInstead of adding the widgets described below manually, use the 'Import Dashboard' button in the 'Add dashboard' dialog to import the example dashboard.
To start implementing this, create a new Dashboard section using the plus icon next to ‘Dashboards’ in the left hand pane. Give the section a name (such as ‘Weather Station Data’), and optionally choose an icon (such as weather-lightning-rainy), then click ‘Add Dashboard’. Once the new section has been created, click the pencil icon at the top of the page to begin adding widgets.
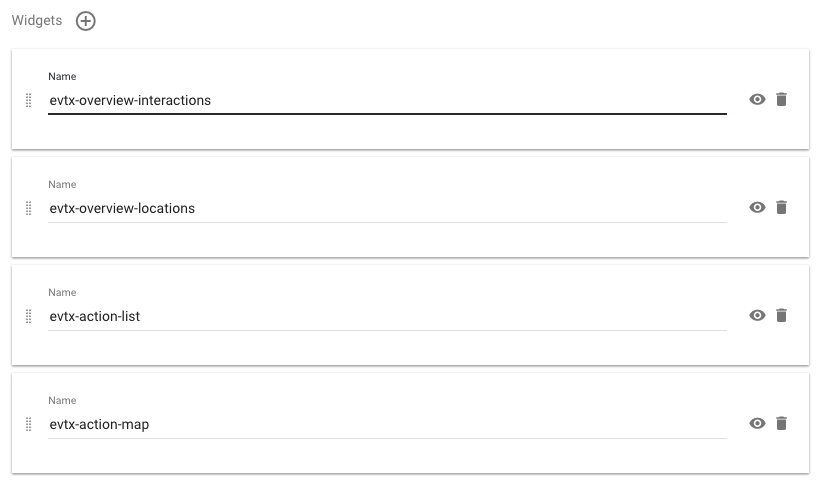
Create the first section using the left hand side of the dashboard section editing dialog, then add the following widgets one by one using the names provided: evtx-overview-locations, evtx-overview-interactions, evtx-action-list, evtx-action-map. At the end, you should have a dashboard section configuration as follows:

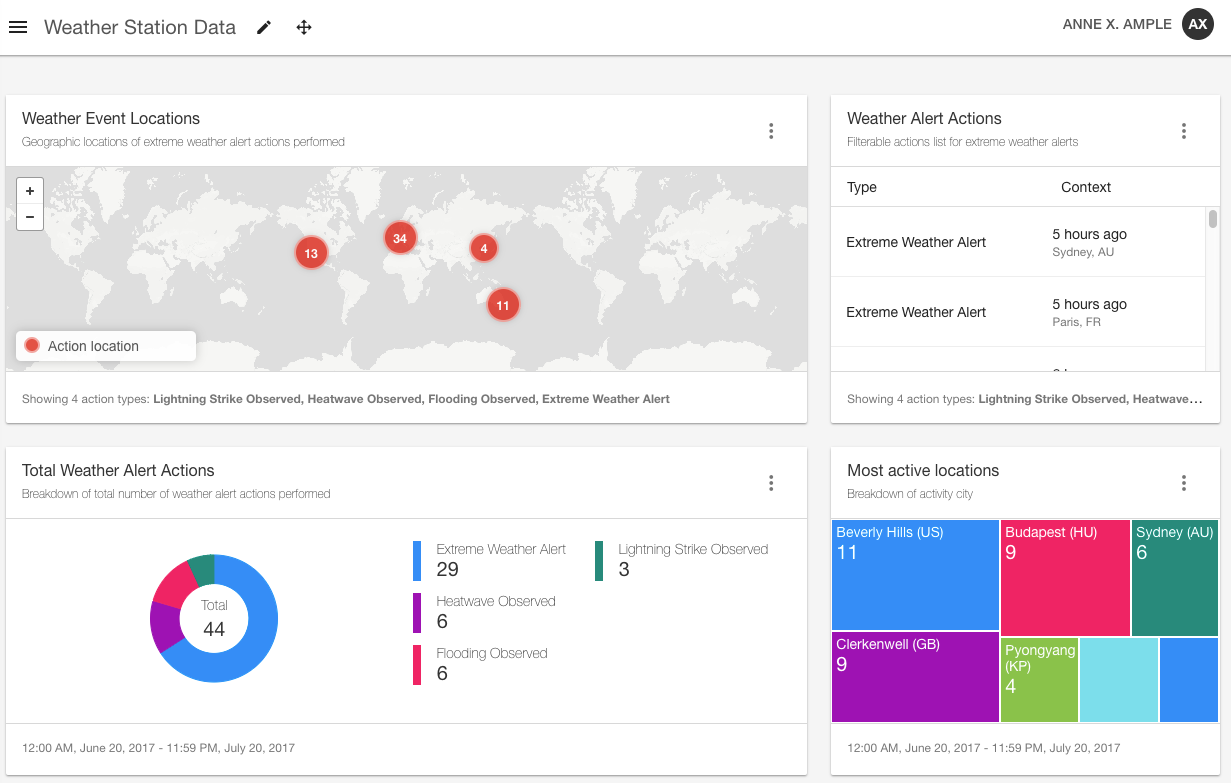
After confirming this configuration, feel free to customise the name and description of each of the widgets, as well as the size and layout, to your liking. With sufficient data accumulated you should see a dashboard section like the one below, and be able to see some fictitious insights into the frequency and distribution of extreme weather events as recorded by the weather station Thngs.

Wrapping Up
After following through this walkthrough, you should have gained an insight into how some of the various basic resource types of the EVRYTHNG Platform can play a useful role in an example connected devices scenario. To recap:
- Projects are used to limit access and visibility of resources.
- Applications represent remote apps/integrations, and are used to give access to users of the app.
- Products represent classes of objects, and are used to share metadata across instances.
- Thngs are the main data containers, and are used to be the physical counterpart of real-world objects, projects, and devices.
- Properties are used to be the historical record of the object’s state, whereas actions represent discrete events.
- Roles and permissions can be used to limit data for account operators and Application Users as required.
- Dashboard widgets can be customized to display insightful summaries of actions.
Check out some more features of the API to see what else is possible:
- Reactor - scripting reactions to actions, property changes, and schedules.
- Collections - group Thngs together and operate on them as a single entity.
- Pub/Sub Broker - Use MQTT to connect devices to the EVRYTHNG API.
Updated 8 months ago
